






Understanding support and resistance levels is one of the most important foundations of technical analysis. Whether you trade stocks, forex, cryptocurrencies, or commodities, these price areas can help you interpret market behavior, identify potential trading opportunities, and manage risk.
When combined with trendlines, support and resistance analysis becomes even more useful. Traders can study not only where prices have reacted in the past but also how the market’s direction and structure are developing.
In this guide, we explain how support and resistance levels work, how to draw trendlines correctly, and how traders can use these tools to evaluate breakouts, reversals, and potential trade setups.
What Are Support and Resistance Levels?
Support and resistance are price areas where buying or selling pressure has previously influenced market movements.
Support is an area where buying interest may become strong enough to slow or temporarily reverse a price decline.
Resistance is an area where selling interest may become strong enough to slow or temporarily reverse a price increase.
For example, imagine a stock repeatedly declines toward $100 but rebounds each time. Traders may identify the area around $100 as potential support.
If the same stock repeatedly rises toward $120 and struggles to move higher, the area around $120 may be considered resistance.
These levels do not represent guaranteed turning points. Prices can move through them, sometimes rapidly, especially when market conditions change.
Why Do Support and Resistance Levels Matter?
Support and resistance levels can help traders identify areas where market participants previously reacted to price changes.
They are often associated with several factors:
- Market psychology: Traders may remember previous highs and lows and use them when making decisions.
- Supply and demand: Buying and selling interest can become concentrated around particular price areas.
- Previous trading activity: Historical consolidation zones may attract renewed attention.
- Round numbers: Prices such as $50, $100, or $1,000 can become psychological reference points.
However, historical reactions do not establish that a level will remain important in the future.
How to Identify Support and Resistance Levels
One of the simplest methods is to examine previous swing highs and swing lows on a price chart.
A swing high is a local peak where price stops rising and begins moving lower. A swing low is a local trough where price stops falling and begins moving higher.
Traders can mark areas where multiple historical turning points occurred.
Step 1: Start With a Higher Timeframe
Begin by examining a daily or weekly chart to identify major historical price areas.
Higher timeframes often provide a clearer view of broader market structure because they contain fewer short-term fluctuations.
However, a level identified on a weekly chart may be too broad for a short-term trade. The appropriate timeframe depends on the trading strategy.
Step 2: Identify Repeated Price Reactions
Look for areas where price has reversed, consolidated, or struggled to continue moving.
Repeated reactions may indicate that an area deserves attention.
Nevertheless, the number of touches alone does not determine whether support or resistance will hold.
Step 3: Draw Zones Rather Than Expecting Exact Prices
Support and resistance often function better as zones than as precise horizontal lines.
For example, instead of assuming that support exists at exactly $100.00, a trader might identify a relevant area between $99.50 and $100.50.
The appropriate width depends on the instrument’s volatility, trading timeframe, and historical price behavior.
Drawing zones can help avoid treating minor price movements beyond a line as automatic breakouts.
Step 4: Monitor How Price Responds
After identifying a level, observe what happens when price approaches it.
Does price reject the area? Does it consolidate? Does it move decisively through the zone?
The reaction provides additional information, but it should be interpreted alongside the broader trend and risk considerations.
What Are Trendlines in Trading?
A trendline is a diagonal line drawn on a chart to illustrate the direction of price movement.
Unlike horizontal support and resistance levels, trendlines can change in price over time.
They are commonly used to identify upward and downward market structures.
Uptrend Lines
An upward trendline is typically drawn beneath price by connecting two or more relevant rising swing lows.
In an uptrend, prices generally form higher highs and higher lows.
The line can help traders visualize an area of potential dynamic support.
However, an upward trendline does not guarantee that price will bounce when it reaches the line.
Downtrend Lines
A downward trendline is typically drawn above price by connecting two or more relevant declining swing highs.
In a downtrend, prices generally form lower highs and lower lows.
The trendline may act as a reference for potential dynamic resistance.
A break above the line can indicate that the previous downward structure is changing, but it does not necessarily confirm a lasting bullish reversal.

How Many Touches Make a Trendline Valid?
Two points are sufficient to draw a straight line. A third reaction can provide additional evidence that the line is being respected.
However, there is no universal rule stating that three touches make a trendline reliable.
Trendlines are partly subjective. Different traders may select different swing points, particularly on volatile charts.
The goal is to identify a reasonable market structure rather than force a line to fit every price movement.
How to Use Support, Resistance, and Trendlines Together
Support and resistance levels become particularly interesting when they overlap with other technical observations.
For example, imagine a stock is moving in an established uptrend.
Its price begins pulling back toward a previous horizontal support zone. At approximately the same area, an upward trendline connects several earlier swing lows.
A trader might consider this a potentially important area because two different chart observations point toward a similar price region.
This is sometimes called technical confluence.
Confluence can help traders organize their analysis, but it does not guarantee a successful trade. Multiple technical tools can reflect the same underlying price behavior rather than provide truly independent confirmation.
Three Common Trading Approaches
Trading a Potential Support Bounce
A support-bounce approach involves monitoring price as it approaches an identified support zone.
Rather than buying simply because price touches the level, a trader may wait for additional evidence of buying interest.
Possible observations include a bullish candlestick reaction, improving momentum, or a change in short-term market structure.
A hypothetical trading plan could include an entry condition, an invalidation level below the support zone, and a potential target near the next resistance area.
The risk is that support fails and price continues declining.
Trading a Resistance Breakout
A breakout occurs when price moves beyond an established support or resistance area.
For example, suppose a stock has repeatedly failed to move above $120.
If price subsequently breaks above that resistance zone, some traders may interpret the move as a potential sign of strengthening demand.
However, not every breakout produces a sustained trend.
Traders may examine the closing price, volatility, volume where available, and broader market conditions before evaluating a possible entry.
Trading a Breakout and Retest
A breakout-and-retest approach involves waiting for price to break a level and then return toward it.
For example, after resistance at $120 is broken, price might pull back toward the former resistance zone.
If buying interest appears there, the area may begin functioning as support.
This is often called support and resistance role reversal.
The opposite can happen when broken support later acts as resistance.
Importantly, a retest may never occur. Even when it does, the level can fail again.
False Breakouts: Why Traders Should Be Careful
A false breakout occurs when price moves beyond a recognized level but subsequently returns to the previous trading range.
For instance, price may briefly move above resistance, attract breakout buyers, and then fall back below the level.
False breakouts can occur because of changing liquidity, volatility, news, or temporary order imbalances.
Several practices can help traders evaluate breakout risk:
- Consider whether price closes beyond the level rather than merely crossing it intrabar.
- Assess the broader trend and market environment.
- Avoid assuming that unusually large candles guarantee continuation.
- Define an exit plan before entering a trade.
- Evaluate transaction costs and potential slippage.
No confirmation method eliminates false signals entirely.
How to Draw Support, Resistance, and Trendlines on TradingView
TradingView provides several drawing tools for marking important price areas and trends.
You can use these tools to create your own chart analysis without needing a custom indicator.
Drawing Horizontal Support and Resistance
- Open a financial instrument on a TradingView chart.
- Select the Horizontal Line tool from the drawing toolbar.
- Place the line near an important historical swing high or low.
- Adjust its position after reviewing earlier price reactions.
- Use a rectangle or similar drawing tool when a broader price zone is more appropriate.
Drawing Trendlines
Select the Trend Line drawing tool.
In an uptrend, connect relevant rising swing lows.
In a downtrend, connect relevant declining swing highs.
Extend the line toward current price action.
Review whether the line reasonably represents the market structure without forcing it through unrelated points.
TradingView also supports customizable drawing styles and alerts on certain drawing tools.
Want to practice these techniques? Explore TradingView and use its charting tools to identify support, resistance, and trendlines across different financial markets.

TradingView partner offer: After purchasing your first eligible paid plan through our partner link, you may qualify for a $15 discount on your next eligible plan purchase. The discount does not apply to the initial purchase. Offer terms apply.
Watch Our Video: Support, Resistance, and Trendlines Explained
For a visual explanation of these concepts, watch our video covering support and resistance levels, trendlines, and how traders can use them when evaluating trading decisions.
Watch the Support, Resistance, and Trendlines Tutorial on YouTube
Combining Price Action With Technical Indicators
Support and resistance analysis does not have to be used in isolation.
Some traders combine price levels with technical indicators to gain additional context.
For example:
- RSI: May help evaluate momentum as price approaches an important zone.
- Moving averages: Can provide additional context about the prevailing trend.
- MACD: Can help assess momentum changes.
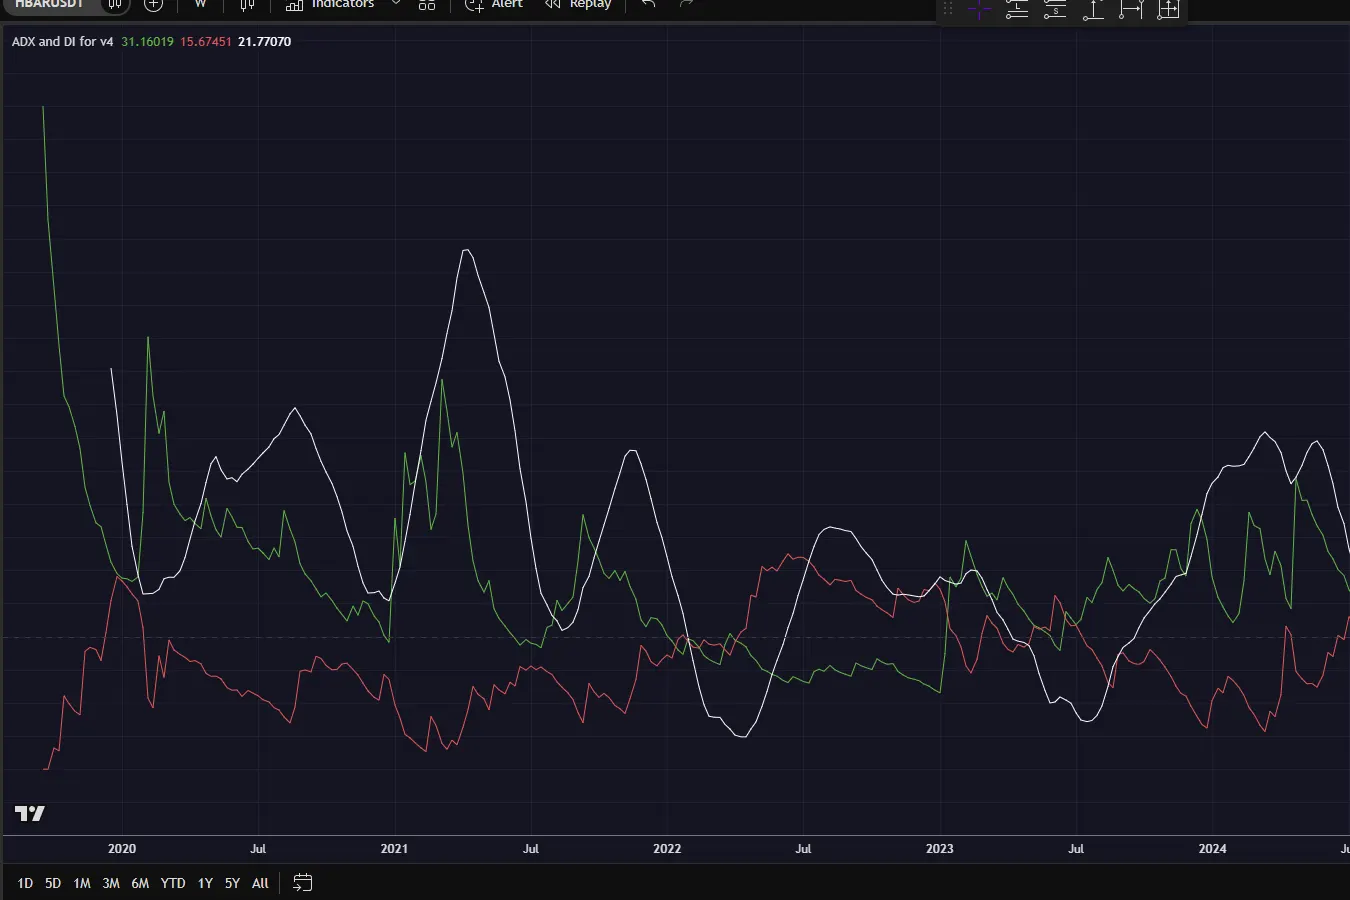
- ADX and DI: Can help distinguish trend strength from directional movement.
The Average Directional Index (ADX) is particularly relevant when assessing whether the market is trending strongly or moving without a clear directional structure.
We also have a dedicated video explaining ADX and DI indicators, which can complement the price action concepts discussed here.
Watch Our ADX and DI Indicator Tutorial
Traders interested in evaluating indicator-based strategies can also explore Temel Backtest Lab, our Pine Script backtesting tool for TradingView.
Remember that an indicator combination should be evaluated systematically. Adding more indicators does not automatically improve performance.
Risk Management When Trading Support and Resistance
Even well-established support and resistance zones can fail.
This makes risk management essential.
Before entering a position, traders should consider where their analysis would be invalidated, how much capital they are willing to risk, and whether the potential reward justifies that risk.
For example, placing a stop-loss exactly on a widely watched level may expose a trade to normal price fluctuations.
A stop-loss should be based on a defined trading plan and the instrument’s volatility rather than an arbitrary distance.
Position sizing is equally important. A technically attractive setup can still produce an unacceptable loss if the position is too large.
Support, resistance, and trendlines are analytical tools, not substitutes for risk management.
Common Mistakes to Avoid
Beginners frequently make several mistakes when applying these concepts.
Drawing too many levels: Marking every minor price reaction can make a chart difficult to interpret.
Treating levels as exact barriers: Markets often move through support and resistance zones temporarily.
Forcing trendlines: A trendline should represent meaningful swing points rather than an expected future price direction.
Ignoring the broader trend: A potential support bounce in a strong downtrend may carry different risks from one in an established uptrend.
Trading without confirmation or a risk plan: A chart level alone does not define a complete trading strategy.
Assuming historical success guarantees future performance: Market conditions change, and patterns can fail.
Final Thoughts
Support and resistance levels and trendlines are among the most accessible tools in technical analysis.
They help traders identify meaningful price areas, understand market structure, and develop more organized approaches to evaluating trading opportunities.
However, they should not be treated as guaranteed buy or sell signals.
A practical approach combines clear chart analysis with an understanding of market conditions, realistic expectations, and disciplined risk management.
If you are new to technical analysis, begin by identifying major support and resistance zones on historical charts. Then practice drawing trendlines and observing how prices react when they approach those areas.
With experience, these concepts can become a useful foundation for more advanced price action and indicator-based strategies.
Disclaimer: This article is for educational and informational purposes only and does not constitute financial or investment advice. Trading involves risk, including the potential loss of capital. No technical analysis method guarantees profitable results.