




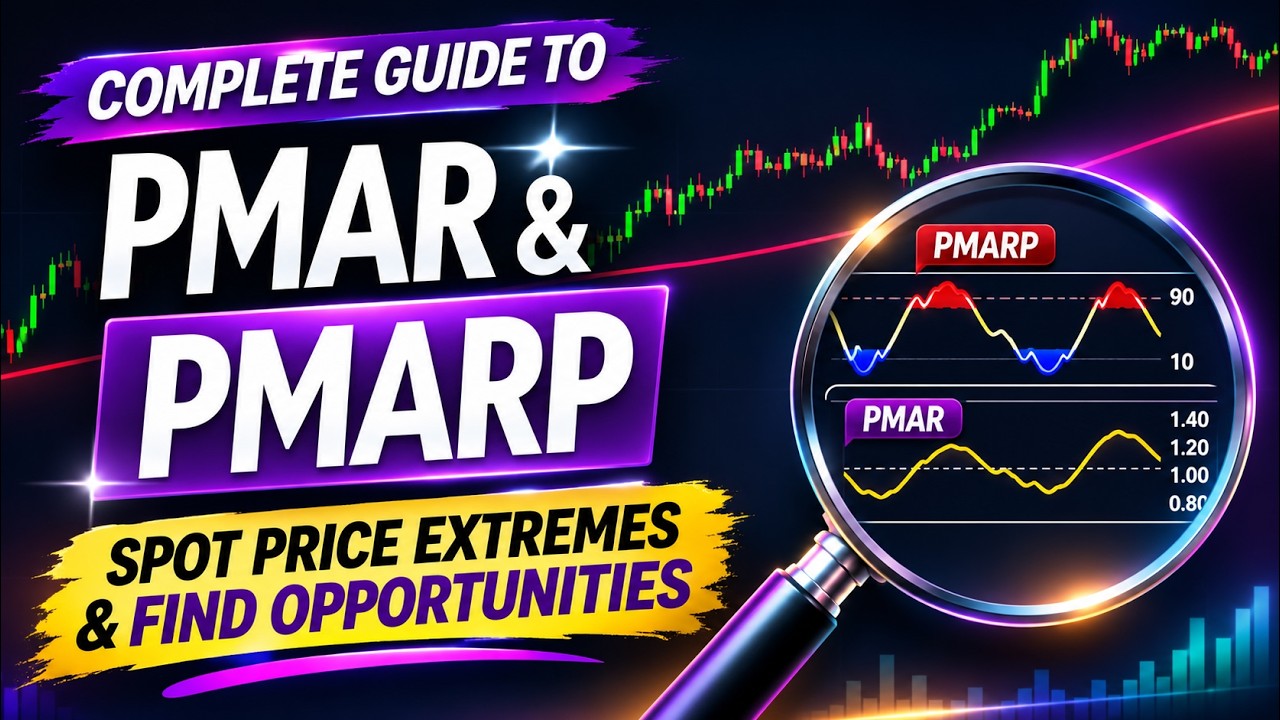

PMAR and PMARP answer two questions about the same chart. How far is price from its moving average, and how unusual is that distance for this market? To see the difference, we’ll use the daily BTC/USD chart with a 200-day simple moving average and a 350-bar percentile lookback. You can follow the video or use the setup steps below.
In this guide
- What PMAR measures
- What PMARP measures
- TradingView setup
- Reading PMAR and PMARP together
- Testing a strategy
What PMAR measures
PMAR stands for Price Moving Average Ratio. Divide the source price, typically the close, by its moving average on the same bar. A reading of 1.00 means the two are equal. Readings above 1.00 place price above the average, and readings below 1.00 place it below.
- $110,000 ÷ $100,000 = 1.10. Bitcoin is 10% above its moving average.
- $95,000 ÷ $100,000 = 0.95. Bitcoin is 5% below its moving average.
To convert PMAR to a signed percentage, subtract 1 and multiply by 100. The ratio can change as price moves, as the moving average moves, or as both move at different speeds.
What PMARP measures
PMARP stands for Price Moving Average Ratio Percentile. It ranks the current PMAR against ratios from a rolling lookback window. A reading near 95 puts the ratio near the high end of that window. A reading near 5 puts it near the low end.
A PMARP of 95 describes a historical rank. The percentage distance comes from PMAR, and the probability of a reversal would require separate testing. A ratio of 1.10 could rank unusually high in a quiet market and be common in a persistent uptrend. A new timeframe, average length, or lookback can change the rank.
How to Set Up PMAR and PMARP on TradingView
- Open a BTC/USD chart and select the 1D timeframe.
- Open Indicators and add Price Moving Average Ratio & Percentile by The_Caretaker.
- In the first instance, set Line Plot Type to PMARP, PMAR Length to 200, PMAR Type to SMA, and PMARP Lookback to 350. Keep Source Price on the close.
- Add the same indicator again. In the second instance, set Line Plot Type to PMAR and use the same source, length, and average type. The percentile lookback applies to the PMARP panel.
Read the upper panel for historical rank and the lower panel for the ratio. You can add a 200-day SMA to the main chart if you also want to see the reference level alongside price.
Reading PMAR and PMARP together
High rank and a large premium. A PMARP above 90 and a PMAR of 1.40 would put the ratio near the top of its recent range while price trades 40% above its SMA. Watch how price reacts at resistance. The gap can narrow through a pullback or through sideways trade as the average rises.
Low rank and a large discount. A PMARP below 10 and a PMAR of 0.80 would put the ratio near the bottom of its recent range while price trades 20% below its SMA. A support hold or a reclaim of a prior level gives you a price event to evaluate for a potential recovery.
Extreme rank and a small gap. PMARP can be high while PMAR remains close to 1.00 if the recent ratios clustered in a narrow range. Check both panels before deciding how stretched price is.
Strong trends can produce repeated red or blue bands as price keeps moving in the same direction. For a potential mean-reversion setup, look for a price reaction at support or resistance and consider whether momentum is weakening. RSI or MACD can add context. A higher-timeframe trend filter can help you define which setups to test.
Testing a strategy
Write down the conditions before you run the test. Choose a PMARP threshold, a minimum distance from the SMA, a confirmation rule, and an exit. Compare the results across different market periods and include trading costs. You can use the free Temel Backtest Lab for TradingView to test rules built from numeric indicator outputs.
Which indicator would you combine with PMARP? Suggest a combination in the YouTube comments for a future Temel Academy backtest.
Sources
- The_Caretaker’s original TradingView indicator and settings
- Temel Academy’s PMAR and PMARP video tutorial
This guide is for educational purposes. Trading involves risk, and past results do not guarantee future performance.