








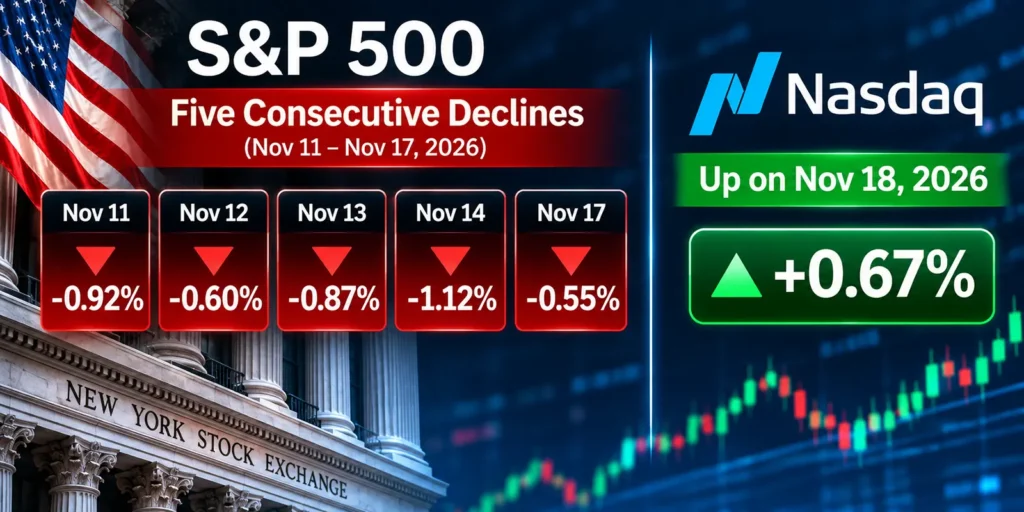
The S&P 500 losing streak reached five consecutive sessions on Wednesday, November 18, 2026, as Wall Street weighed Nvidia’s earnings against concerns about artificial intelligence spending and the interest-rate outlook. The broad US benchmark fell 0.2%, while the technology-heavy Nasdaq finished higher.
S&P 500 Losing Streak: How US Indexes Closed
According to Associated Press market data, the S&P 500 declined 16.90 points to 7,323.63. The Dow Jones Industrial Average fell 561.25 points, or 1.1%, to 50,198.17, while the Nasdaq Composite rose 101.50 points, or 0.4%, to 24,429.88. The Russell 2000 gained 0.5% to 2,714.31. These figures refer to the November 18 US closing session, not live November 19 trading.
Why Nvidia’s Strong Earnings Did Not Lift Every Stock
Nvidia initially advanced following better-than-expected quarterly results and an upbeat sales outlook, but its shares reversed course and ended the session down approximately 2.9%. The response illustrates how high expectations, leadership uncertainty and valuation concerns can outweigh strong reported growth. Other AI-related stocks moved in different directions, making the technology sector’s performance uneven rather than uniformly negative.
Interest Rates and Sector Rotation Add Pressure
Federal Reserve meeting minutes reinforced concern that inflation could keep US monetary policy restrictive. Meanwhile, oil-linked stocks and health insurers weighed on the broader market, while several retailers attracted buyers following encouraging business updates. The split between a rising Nasdaq and falling Dow shows why a single index does not tell the whole market story.
What Investors Should Watch Next
Investors can monitor subsequent inflation releases, Federal Reserve commentary, Nvidia’s execution and the breadth of gains across sectors. The five-session S&P 500 losing streak is a measure of recent market direction, not a reliable forecast of the next session. Comparing price action with market breadth, volume and key support levels can help put short-term volatility in context.
For further background on technical levels, see Temel Academy’s support and resistance education.
The S&P 500 Losing Streak and Diverging Indexes
The S&P 500 losing streak measures consecutive declines in the index at the close. It does not measure how many stocks fell on each of those days. The S&P 500 is weighted by float-adjusted market capitalization, so larger constituents have more influence on its return. Market breadth answers a different question by showing how widely gains or losses were shared.
The Dow is price-weighted, which gives a stock with a higher share price more influence over the index’s point moves. The Nasdaq Composite covers a different group of companies and uses market capitalization weights. These differences help explain how the Nasdaq could finish higher while both the S&P 500 and the Dow closed lower. Comparing percentage changes makes the moves easier to interpret because each index has a different point level.
The reaction to an earnings release also depends on what investors had already priced in. Reported results describe the quarter that just ended, while guidance helps shape expectations for future quarters. A share price can rise immediately after a release and reverse as investors reassess those expectations. To understand whether the reaction spread beyond one company, compare the closing moves of related stocks and check which sectors accounted for the broader index decline. That provides more context than attributing the entire session to the most prominent earnings report.
Bottom Line
The five-day S&P 500 losing streak reflects selective risk-taking rather than a straightforward selloff in every technology stock. Nvidia’s reversal and divergent index performance underline the importance of distinguishing company results from market expectations.
Financial disclaimer: This article is for educational and informational purposes only and is not investment advice. Financial markets involve risk, including the possible loss of capital.
Sources
Associated Press — US index closing data, November 18, 2026