






Kaufman’s Adaptive Moving Average (KAMA) adapts to the efficiency of price movement, helping traders put trends and market noise into context. The KAMA indicator is useful for reading direction, comparing pullbacks and building testable trading rules. It is still a lagging calculation, and a clean-looking line does not guarantee profitable entries.
This guide accompanies Temel Academy’s KAMA video. We explain the 10/2/30 settings, compare KAMA with EMA21, and explore three approaches: price action, two KAMA crossovers and mean reversion.
Affiliate disclosure: This article contains a TradingView affiliate link. If you sign up or purchase a paid plan through it, Temel Academy may earn a commission at no additional cost to you.
Watch the KAMA indicator video
Follow the chart examples in the Temel Academy KAMA tutorial on YouTube, then use the written rules below to structure your own practice.
What is Kaufman’s Adaptive Moving Average?
Developed by Perry Kaufman, KAMA is an adaptive moving average. Instead of applying one fixed smoothing factor to every candle, it changes its response according to how directly price has travelled over a lookback window.
A sequence that moves consistently in one direction has high directional efficiency. A sequence that repeatedly reverses while finishing near its starting price has low efficiency. KAMA usually responds more quickly in the first situation and more slowly in the second. This distinction matters: large candles alone do not necessarily make the average faster.
Reading trend and market noise
Price holding above a rising KAMA can support a bullish interpretation. Price below a falling KAMA can support a bearish interpretation. A flat line with frequent price crossings suggests that directional signals deserve more caution. Read those conditions alongside swing highs, swing lows and nearby levels.
The KAMA indicator does not predict the next candle. Its slope can change after a move is already underway, and sideways markets can still generate repeated false signals. Treat it as a way to organize evidence rather than as an automatic trade instruction.
Kaufman’s Adaptive Moving Average settings: 10/2/30
The video uses KAMA(10,2,30). These are three separate inputs, not three moving averages and not a promise that the line behaves exactly like an EMA with a period between 2 and 30.
- 10: the lookback used to measure the Efficiency Ratio.
- 2: the fast length used in the smoothing calculation.
- 30: the slow length used in the smoothing calculation.
How the calculation works
The Efficiency Ratio compares the absolute net price change over the lookback with the sum of the absolute candle-to-candle changes in that window. It approaches one when movement is direct and approaches zero when price travels back and forth without much net progress.
The fast and slow lengths define two EMA-style smoothing constants. KAMA blends them using the Efficiency Ratio, squares the result and uses that adaptive factor to update the previous average toward the current source price. Because of that squaring step, the input lengths should not be interpreted as literal minimum and maximum EMA periods.
For the implementation and formulas, see TradingView’s official KAMA documentation. Check that your chosen script exposes all three parameters; community scripts and platform versions can label inputs differently.
Adding KAMA to a TradingView chart
- Open your chosen symbol and timeframe in TradingView.
- Open Indicators and search for Kaufman’s Adaptive Moving Average or KAMA.
- Check the indicator’s author and inputs before adding it.
- For the video setup, use efficiency length 10, fast length 2, slow length 30 and Close as the source where these inputs are available.
- Add a 21-period Exponential Moving Average for the comparison, using the same price source.
You can explore TradingView through our affiliate link. Available features and plans may differ; inspect the current terms before purchasing.
KAMA versus EMA21: adaptive and fixed smoothing
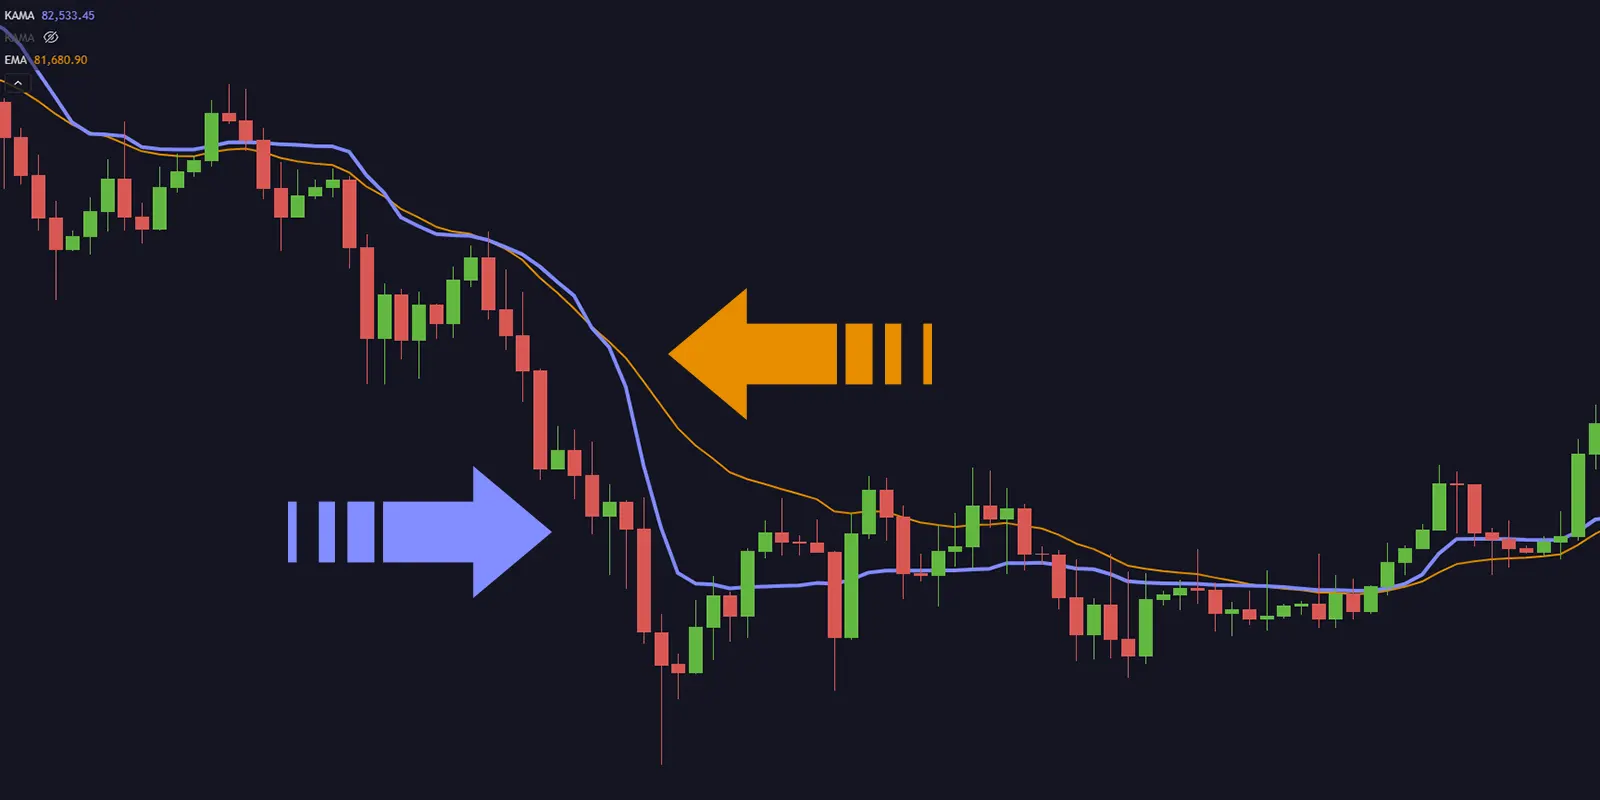
EMA21 uses a fixed smoothing factor based on its 21-period length. KAMA(10,2,30) changes its smoothing factor as directional efficiency changes. Consequently, the distance between the two lines can expand or contract even though you have not changed either indicator’s settings.
| Feature | KAMA(10,2,30) | EMA21 |
|---|---|---|
| Response | Adapts to directional efficiency | Uses a fixed smoothing factor |
| Directional movement | Can become more responsive | Maintains its set response |
| Choppy movement | Can flatten and filter some noise | Continues updating at the same rate |
| Main limitation | Lag and false signals remain | Lag and false signals remain |
Compare the lines across a sustained trend, a range and a transition between them. Avoid deciding which is better from one attractive example. A slower line may reduce some crossings while also delaying an exit; a faster line may capture a turn earlier while producing more whipsaws.
3 practical Kaufman’s Adaptive Moving Average strategies
The following frameworks explain the approaches covered in the video. They are educational starting points for testing, not verified profitable systems. Define exact entry, invalidation and exit rules before assessing results.
1. Combine KAMA with price action
Start with market structure. In an uptrend, look for higher highs and higher lows with a rising KAMA. A pullback toward the average becomes more interesting when it overlaps a previously tested support area. Wait for a completed candle or another predefined price-action trigger rather than buying merely because price touches the line.
For an illustrative long setup, require a rising KAMA, an intact higher low and a candle that closes back above the average after a pullback. Place the invalidation beyond the structural level that makes the idea wrong, then assess whether the next resistance leaves enough room after costs. Reverse the directional logic when studying bearish setups, if short selling is available and appropriate.
A close below KAMA can be an exit condition in a tested ruleset, but it is not automatically a reversal signal. Learn how to identify the surrounding levels in our support and resistance guide.
2. Test two KAMA crossovers: 10/2/30 and 10/5/30
Add KAMA(10,2,30) and KAMA(10,5,30) to the same chart. Both use an efficiency lookback of 10 and a slow length of 30. Changing the fast length from 2 to 5 makes the second line less responsive when directional efficiency rises.
A bullish crossover occurs when the 10/2/30 line moves above the 10/5/30 line. A bearish crossover occurs when it moves below. For testing, record the crossover only after the candle closes, and specify whether the hypothetical order is filled at the next candle’s open or under another realistic execution rule.
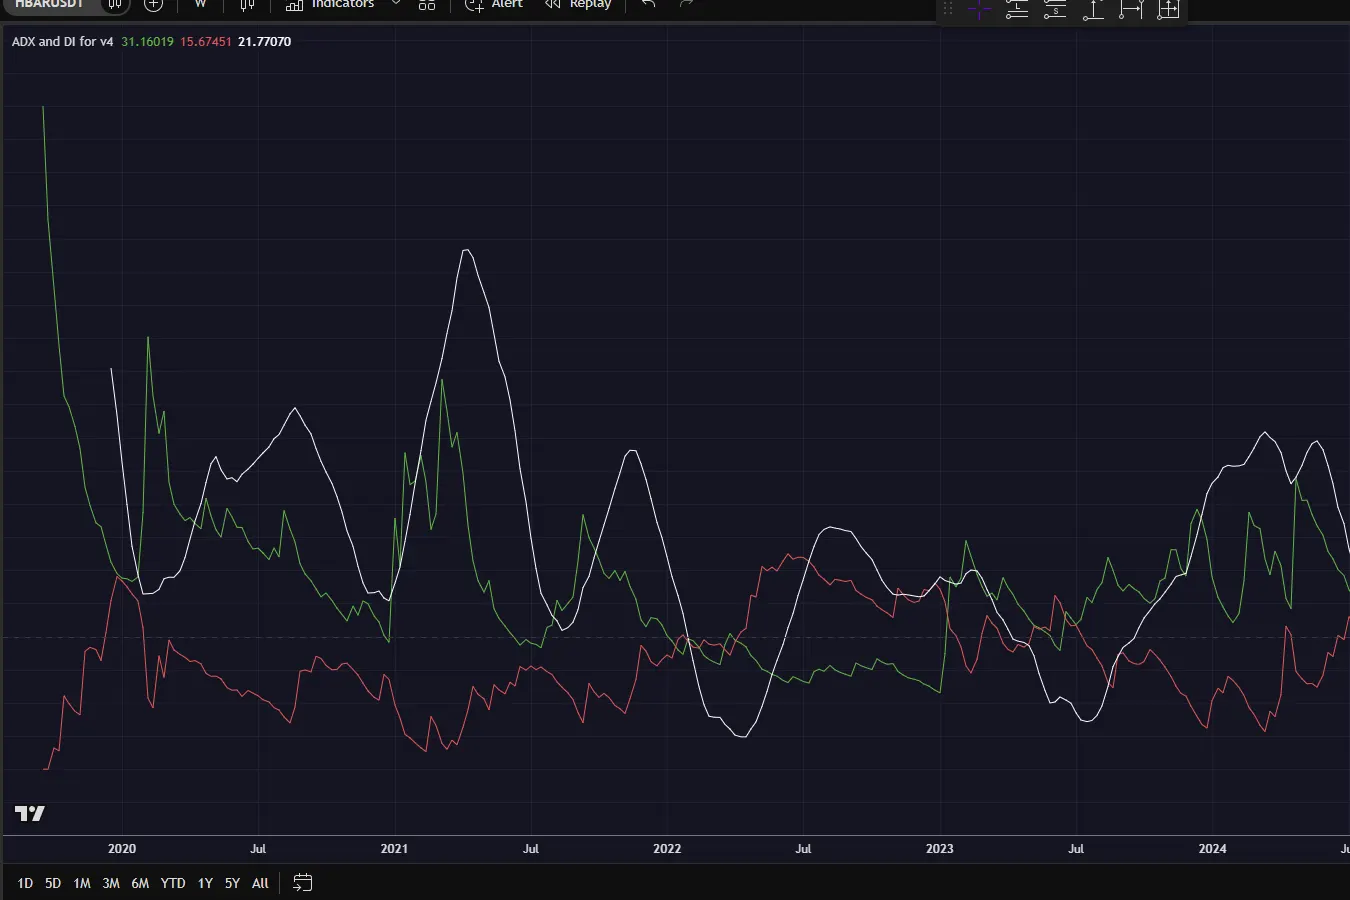
Consider filtering signals with the slope of the slower KAMA, market structure or a separately defined trend-strength condition. Closely spaced crossovers around flat lines are a common warning of range conditions. Adding an ADX filter is one possible experiment; our ADX indicator guide explains how trend strength differs from direction.
Do not optimize the filter until every losing example disappears. A complex combination can fit historical noise while failing on new data. Compare the basic crossover rules with the filtered version using the same sample and costs.
3. Explore mean reversion toward KAMA
Mean reversion asks whether an unusually extended move may return toward an average. In this approach, KAMA is a reference level rather than a guarantee that price must come back. A large gap between price and the line can persist through a strong trend.
First define what extended means, for example a distance measured relative to ATR rather than an arbitrary number of currency units. Then require a suitable market context and confirmation, such as rejection at established resistance or support. RSI or a candlestick pattern can add context, but neither removes the possibility of continued movement against the position.
For an illustrative range setup, identify the range boundary, wait for a failed breakout or rejection, and assess whether a move toward KAMA offers sufficient potential relative to the invalidation distance. Skip the idea when the market breaks out and holds beyond that boundary. Never keep adding to a losing trade simply because the average looks far away.
Backtesting and risk management for a KAMA strategy
Before risking money, convert the KAMA indicator approach into rules another person could reproduce. A chart annotation is not a backtest. Include trades that failed, signals you would have missed and periods when the indicator stayed flat.
- Specify the environment: symbol, timeframe, session, price source and indicator implementation.
- Define the signal: exact crossover, slope, price-action condition or extension threshold.
- Define execution: candle-close confirmation, fill timing, order type and assumptions about spread.
- Define risk: structural or volatility-based stop, position size, exit and maximum acceptable loss.
- Include costs: fees, slippage and funding or borrowing costs where relevant.
- Validate: separate development data from unseen data, then practice with paper trading.
Review expectancy, drawdown, average win relative to average loss, exposure and the number of trades. A high win rate alone does not establish a useful system. Compare results across trending and ranging periods, and check whether a few exceptional trades explain most of the outcome.
Our TradingView backtesting tutorial provides a broader testing workflow. You can also explore Temel Backtest Lab; verify that a tool supports your exact inputs and rules before treating its results as evidence for this setup.
Position sizing example
If a hypothetical account is 10,000 units and the trader chooses to risk 0.5%, the planned loss budget is 50 units. With a stop distance of 2 units per share, the simple size calculation is 25 shares before fees and execution adjustments. This is an arithmetic illustration, not a recommended risk percentage. Contract multipliers, leverage, gaps and slippage can materially change the actual loss.
Common Kaufman’s Adaptive Moving Average mistakes
- Assuming 10/2/30 is the best setting for every asset and timeframe.
- Confusing directional efficiency with volatility alone.
- Entering on an intrabar crossover that disappears before the candle closes.
- Ignoring support, resistance and the room available before the next obstacle.
- Using mean reversion against a strong trend without a clear invalidation rule.
- Reporting results without fees, drawdowns or an out-of-sample check.
Kaufman’s Adaptive Moving Average FAQ
What are the standard KAMA settings?
The common starting point is 10/2/30: efficiency lookback 10, fast length 2 and slow length 30. These inputs describe the calculation, not a universal optimal trading setup.
Is KAMA better than EMA21?
There is no universal winner. EMA21 has fixed smoothing, while KAMA adapts to directional efficiency. Compare the complete rules, execution costs and risk outcomes on the market and timeframe you intend to study.
Can I use KAMA on crypto, forex or stocks?
The calculation can be applied to different price series. That does not imply equal performance across markets. Trading hours, liquidity, gaps, leverage and costs require separate testing.
What is the difference between KAMA(10,2,30) and KAMA(10,5,30)?
The fast length changes from 2 to 5. The second line is less responsive at higher efficiency readings, creating a comparison that can be used for crossover research. Both lines can still produce false signals.
Should KAMA be used alone?
Use it within a complete decision process that includes price structure, predefined risk and validation. Additional indicators such as RSI, MACD or ADX should have a specific purpose; adding more signals does not automatically improve a strategy.
Build a testable process around KAMA
Kaufman’s Adaptive Moving Average offers an adaptive way to read price movement. Begin with 10/2/30, compare its behavior with EMA21, and study the three approaches separately before combining them. Watch the video, write down the rules and test whether the behavior remains useful after realistic costs.
Risk warning: This material is for education and general information only and is not personalized investment advice or a recommendation to buy or sell any asset. Trading can result in substantial losses, especially with leverage. Indicators and historical or hypothetical results do not guarantee future performance. Read our financial disclaimer before acting on any educational example.